$39,828 in revenue from $2,541 in paid spend — and SEO alone contributed $17,183 of it.
A 15.67× blended return on ad spend across a 28-day window — but the number that matters more is this: 43% of total revenue came from Organic Search, at zero ad cost. This is what full-funnel performance marketing looks like when SEO and paid channels are built to work together, not in isolation.
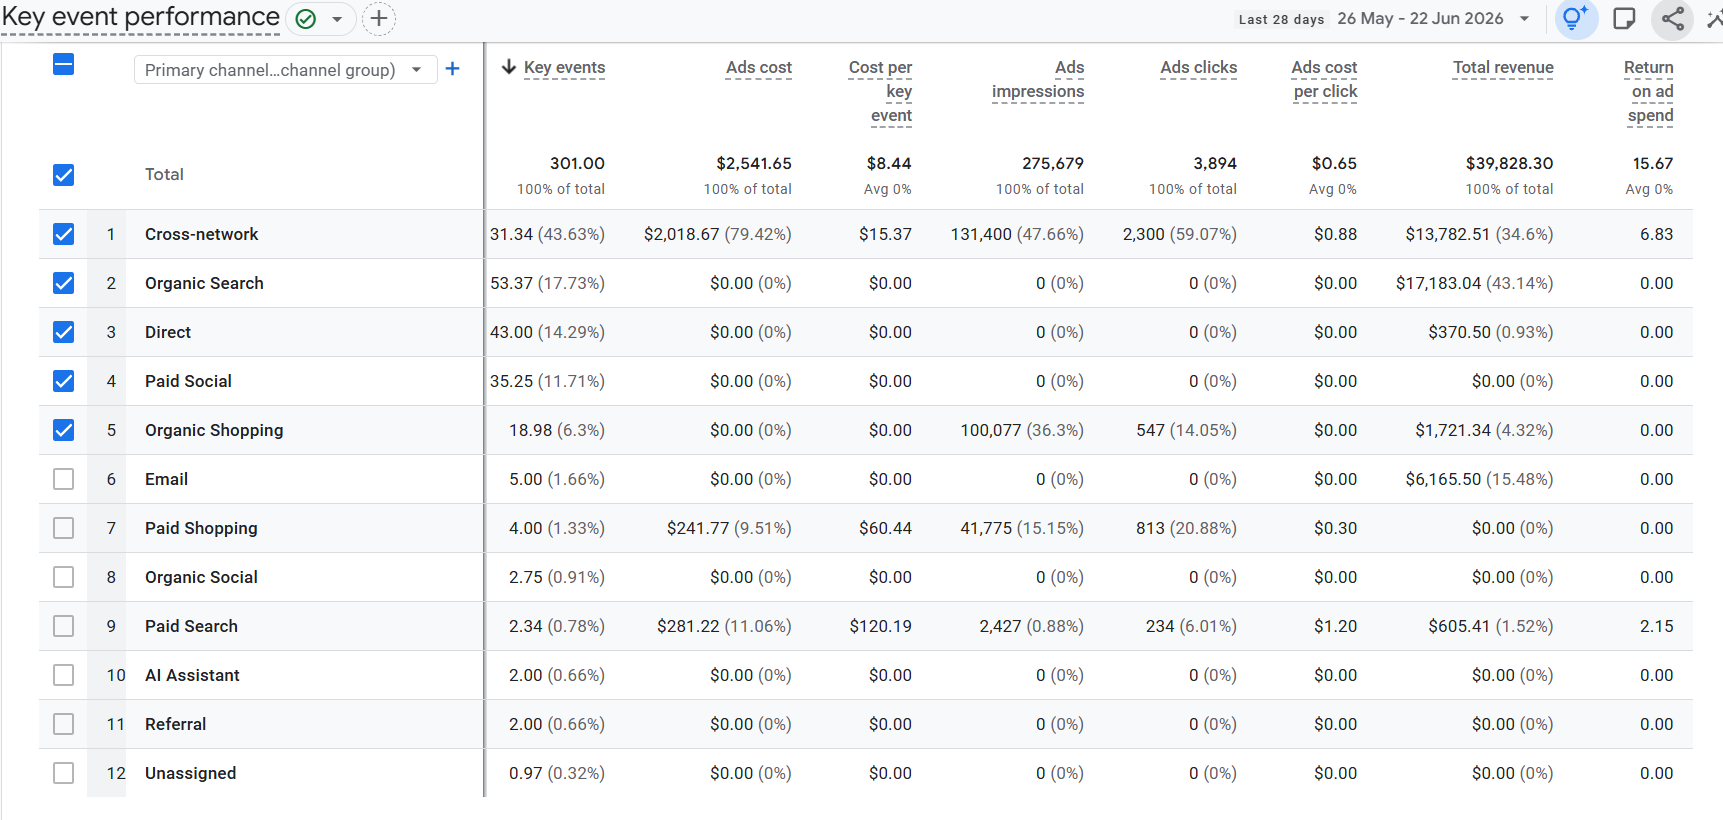
Google Analytics 4 · Key Event Performance by Primary Channel Group · 26 May – 22 Jun 2026
The business and the brief
This is a premium furniture brand selling high-value, considered-purchase products. The brief wasn't just "run some Google Ads" — it was to build a complete performance marketing system where every channel contributes to revenue in a measurable way. That means paid search, shopping campaigns, and SEO working from the same strategic foundation.
Over the 28-day reporting window, the account generated 301 key events (purchases and high-intent actions) worth $39,828.30 in total revenue, from a combined paid investment of $2,541.65. At an average order value implied by the channel data, these are not impulse purchases — each conversion represents a deliberate buying decision from a qualified customer.
Where the revenue actually came from
The full channel breakdown tells a more interesting story than the headline ROAS number alone.
| Channel | Key Events | Ad Spend | Revenue | ROAS | Cost/Event |
|---|---|---|---|---|---|
| Organic Search | 53.37 | $0.00 | $17,183.04 | ∞ | $0.00 |
| Cross-network (PMax) | 31.34 | $2,018.67 | $13,782.51 | 6.83× | $15.37 |
| Direct | 43.00 | $0.00 | $370.50 | — | $0.00 |
| Paid Social | 35.25 | $0.00 | $0.00 | — | $0.00 |
| Organic Shopping | 18.98 | $0.00 | $1,721.34 | — | $0.00 |
| 5.00 | $0.00 | $6,165.50 | — | $0.00 | |
| Paid Shopping | 4.00 | $241.77 | $0.00* | — | $60.44 |
| Paid Search | 2.34 | $281.22 | $605.41 | 2.15× | $120.19 |
| Total | 301.00 | $2,541.65 | $39,828.30 | 15.67× | $8.44 |
* Paid Shopping shows $0 revenue in this GA4 view — likely an attribution model difference, not actual zero. Revenue from Shopping campaigns is partially captured under Cross-network (Performance Max) and Organic Shopping.
The channel that cost nothing and returned the most
Organic Search generated $17,183.04 in revenue — 43% of the total — with zero ad spend attached to it. This is the compounding return on SEO investment: traffic that was built over time and continues to convert without any per-click cost. For a premium furniture brand where customers research extensively before buying, organic visibility at the top of the funnel is not optional — it's where the consideration phase starts.
Organic Shopping added another $1,721.34 from 100,077 impressions and 547 clicks — also at no direct cost. Combined, free organic channels contributed $18,904 in revenue, or 47.5% of the total, from a combined ad spend of exactly $0.
Organic Search + Organic Shopping generated nearly $19,000 in revenue at zero incremental cost in a single 28-day window. This is the return on SEO that doesn't show up in a Google Ads report — which is exactly why tracking it in GA4 across all channels matters.
What the paid campaigns contributed
The total paid investment of $2,541.65 generated $14,387.92 in directly attributed revenue — a paid-only ROAS of 5.66×. The majority of this came from Cross-network campaigns (Performance Max) at 6.83×, which is a solid return for a considered-purchase product category where the customer journey spans multiple sessions and touchpoints.
Paid Search is running at 2.15× — lower than ideal, and the channel worth looking at next for optimisation. At $120.19 per key event and 2.34 events from $281.22 in spend, this campaign is working but not at the efficiency level of the rest of the account. That's the next lever.
Cross-network — 6.83× ROAS
$2,018.67 in spend generated $13,782.51 in revenue. At 131,400 impressions and $0.88 average CPC, Performance Max is doing the heavy lifting on the paid side — reaching buyers across Search, Shopping, Display, and YouTube from a single campaign.
Email — $1,233 per transaction
5 key events generated $6,165.50 — an average of $1,233 per event with zero ad cost attached. For a premium furniture brand, email is functioning as a high-intent reactivation channel for customers who already know the brand. This revenue doesn't require new acquisition spend.
Paid Shopping — attribution gap
$241.77 in spend shows $0 attributed revenue in this view — not because it isn't working, but because GA4's last-click attribution model likely credits the final conversion to Cross-network when Shopping and PMax overlap. A data-driven attribution model would redistribute this.
Paid Search — optimisation opportunity
2.15× ROAS at $120.19 per event is the weakest paid channel. With only 234 clicks and 2,427 impressions, this campaign is small but inefficient. Keyword structure and match type review is the immediate next step.
Why the blended number is the right number
Most agencies report ROAS in isolation — the paid channels only. That gives you one number: 5.66× on $2,541 in paid spend. It's a good number. But it misses the full picture of what a performance marketing system actually produces.
When you track everything — paid and organic, ads and SEO, direct and email — the number is 15.67× on the same $2,541 in spend. The difference is $25,440 in revenue that doesn't appear in a Google Ads report but absolutely appears in the bank account.
5.66× is what the paid campaigns returned alone. 15.67× is what the full performance marketing system returned. The gap — nearly 10 additional ROAS points — represents SEO, email, and organic shopping doing their jobs. This is why we track everything in GA4, not just what appears in the ads dashboard.
For a premium furniture brand with long consideration cycles, this multi-touch visibility isn't a reporting preference — it's the only way to make accurate budget decisions. Optimising for paid ROAS alone, without seeing what SEO and email are contributing alongside it, leads to overspending on acquisition and underpaying for the channels that are quietly generating nearly half the revenue.
Want this kind of visibility into your own account?
Book a free 30-minute call. I'll show you what your real blended ROAS looks like — across paid and organic, not just what the ads dashboard reports.